Eli,
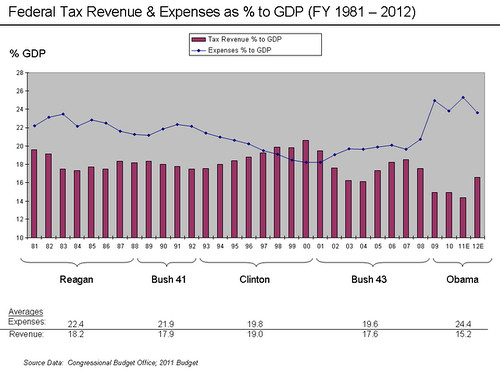
Love that chart on the annual revenues and outlays since Reagan. Let's look at the summary table CBO has at the bottom of the chart. With that data we can calculate the simple average (weighted average would be better) deficit for each President:
President Avg. Deficit/GDP
Clinton -0.8%
Bush 43 -2.0%
Bush 41 -4.0%
Reagan -4.2%
Obama -9.2%
Now I know you imply I characterize Bush 43 as a paragon of fiscl rectitude, which I don't, and I know you are being a bit snide (admit it), but from the numbers you show, well, he was.
Here's the other thing. So the Obama deficits are the fault of Bush. But the Bush policies, which presumably were in place for the Bush administration resulted in 2% deficits, but when Obama becomes President they are magically turned into 9.2% deficits. GDP is about $15 trillion per year. The gap between the Presidents is about 7% of $15 trillion, or $1 trillion. The notion that Bush is responsible for Obama's deficits just doesn't add. Or as they say in Texas, "That dog don't hunt."
No comments:
Post a Comment